2D Map Editor
The 2D Map Editor is a tool within the Navigation Editor that lets you directly edit GeoTIFF tile map raster images. Use it to modify navigation maps such as segmentation maps, collision maps, and drop-off maps.
Screen Layout
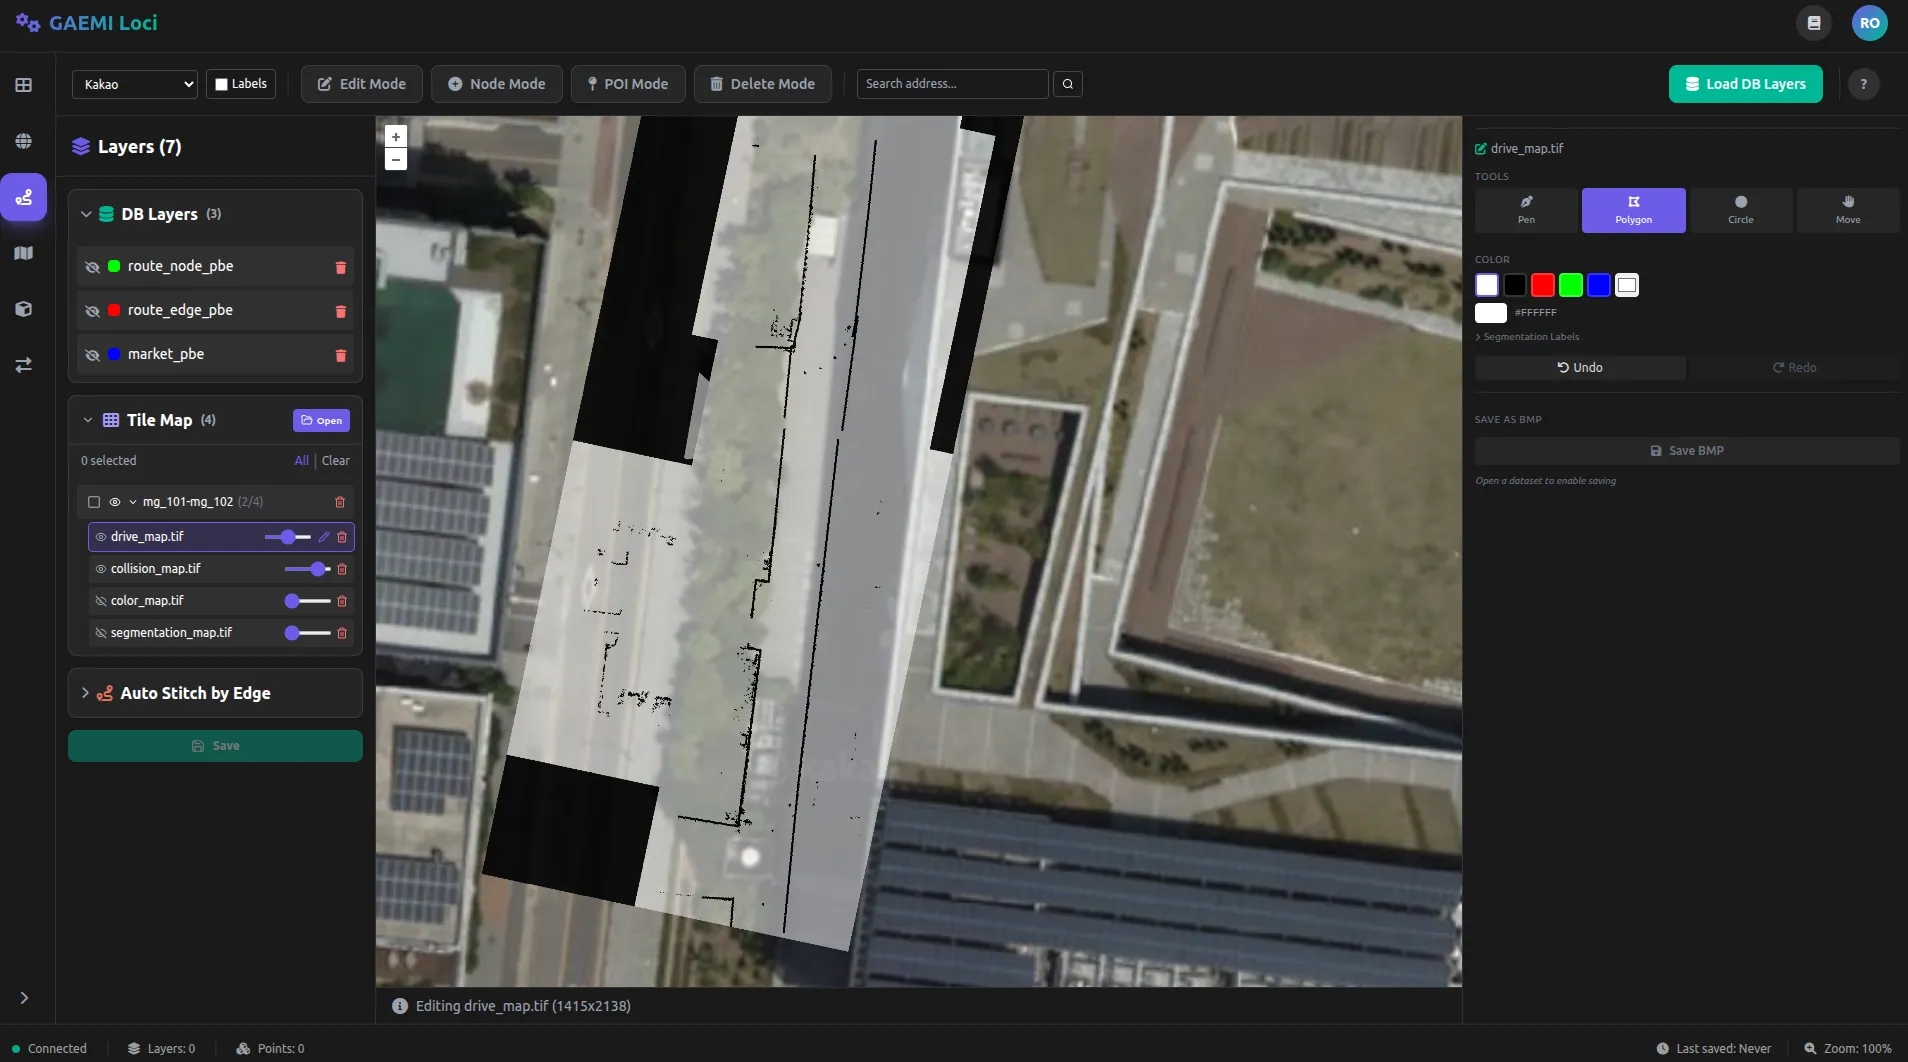
- Left panel: Select the tile map to edit from the layer list (click the pencil icon)
- Center area: Overlay and directly edit the raster image on an OpenLayers map
- Right panel: Editing tools, color selection, brush settings, panorama viewer
Starting and Ending Editing
Click the pencil icon () on a GeoTIFF layer in the left layer panel to start editing.
| Action | Method |
|---|---|
| Start editing | Click the pencil icon on a .tif layer in the left panel |
| End editing | Ends automatically after Save BMP, or click Stop Edit |
| Switch layer | Clicking the pencil icon on another layer saves the current edits and switches to that layer |
Drawing Tools
Select a tool at the top of the right panel. You can also switch tools using keyboard shortcuts.
| Tool | Icon | Shortcut | Function |
|---|---|---|---|
| Pen | P | Draw freely with Bezier curves. Drag to adjust curvature | |
| Polygon | O | Click to place polygon vertices, then fill the area | |
| Circle | C | Stamp a circle at the clicked location | |
| Move | Space | Map pan mode (no drawing) |
Pen Tool (Bezier)
- Click on the map to add points
- Drag to adjust Bezier handles and create curves
- Right-click to finish drawing
- Esc to cancel
- Adjust line thickness with the Stroke Width slider (1–100px)
Polygon Tool
- Click on the map to add vertices in order
- Right-click to close the polygon and fill its interior
- Esc to cancel
Circle Tool
- Click on the map to stamp a circle at that location
- Adjust size with the Circle Size slider (2–200px)
- Quick presets:
| Preset | Size | Purpose |
|---|---|---|
| Bollard | 5px | Bollard-sized obstacle |
| Lamp | 10px | Street-lamp-sized obstacle |
| Post | 20px | Post-sized obstacle |
| Large | 50px | Large obstacle |
Color Selection
Default Color Presets
| Color | RGB |
|---|---|
| White | (255, 255, 255) |
| Black | (0, 0, 0) |
| Red | (255, 0, 0) |
| Green | (0, 255, 0) |
| Blue | (0, 0, 255) |
You can also pick any color using the custom color picker next to the presets.
Segmentation Label Colors
Expanding the Segmentation Labels toggle lets you directly pick colors for each segmentation class:
| Label | Color | Purpose |
|---|---|---|
| runway | Green | Drivable path |
| curb | Purple | Curb |
| road | Red | Roadway |
| cross-walk | Light green | Crosswalk |
| braille-block | Yellow | Braille block |
| cement | Cyan | Cement |
| building | Olive | Building |
| vegetation | Green | Vegetation |
| docking-station | Blue | Docking station |
| no-information | Black | No information |
A total of 26 segmentation classes are defined.
Undo / Redo
| Action | Shortcut | Description |
|---|---|---|
| Undo | Ctrl + Z | Undo the last drawing action |
| Redo | Ctrl + Shift + Z | Reapply the action that was undone |
Export (Save BMP)
After editing, click the Save BMP button to:
- Convert the current canvas to BMP format
- Save it to the dataset path on the server
- Automatically exit editing mode
Typical Workflow
1. [Open Dataset] → Load tile map data from server/local storage2. Click the pencil icon on the .tif layer in the left panel → Enter editing mode3. Select a tool in the right panel (Pen/Polygon/Circle)4. Select a color (preset, custom, or segmentation label)5. Draw directly on the map - Click a trajectory point → Verify the scene in the panorama while editing6. Use Undo (Ctrl+Z) if you make a mistake7. [Save BMP] → Save as a BMP file and exit editing